about recent research:
in The Economist
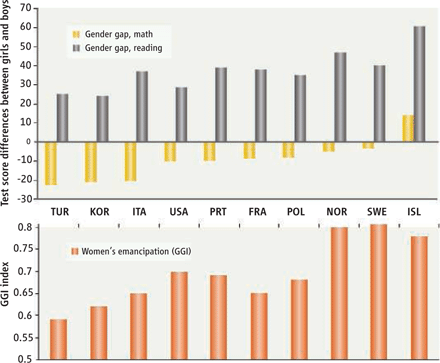
“Vital statistics: Girls are becoming as good as boys at mathematics, and are still better at reading” [h/t /etc list]
ABC News story
“Study: Girls in Sexist Societies Worse at Math – Countries with Higher Gender Equality Produce Girls Who Are Better at Math”
the original study in Science Magazine: “Diversity: Culture, Gender, and Math” [restricted access] & Supporting Online Material
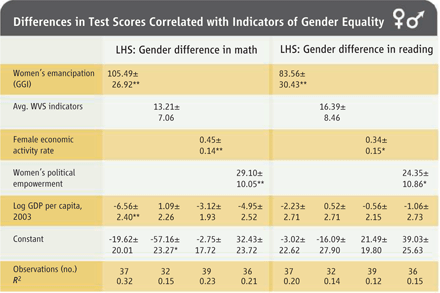
“The existence (1), degree (2), and origin (3, 4) of a gender gap (difference between girls’ and boys’ scores) in mathematics are highly debated. Biologically based explanations for the gap rely on evidence that men perform better in spatial tests, whereas women do better in verbal recall ones (1, 5, 6). However, the performance differences are small, and their link with math test performance is tenuous (7). By contrast, social conditioning and gender-biased environments can have very large effects on test performance (8).
To assess the relative importance of biological and cultural explanations, we studied gender differences in test performance across countries (9). Cultural inequalities range widely across countries (10), whereas results from cognitive tests do not (6). We used data from the 2003 Programme for International Student Assessment (PISA) that reports on 276,165 15-year-old students from 40 countries who took identical tests in mathematics and reading (11, 12). The tests were designed by the Organisation for Economic Co-operation and Development (OECD) to be free of cultural biases. They are sufficiently challenging that only 0.6% of the U.S. students tested perform at the 99th percentile of the world distribution.”

Science 30 May 2008:
Vol. 320. no. 5880, pp. 1164 – 1165
DOI: 10.1126/science.1154094
below the fold, some commentary in romanian (english quotes)
……………………………………………………………………………………………………………….
e interesant si chiar riguros studiul, iar articolul de pe abc news il prezinta destul bine (socant!).
din pacate nu are date si despre romania, si nici cercetarea pe care s-au bazat pentru comparatia intre performanta fetelor si baietilor la mate si citire in diferite tari nu include info despre ro.:
————————
PISA data
The Programme for International Student Assessment (PISA) is an every-three-year
international survey of 15-year-old students aimed at determining their knowledge and
skills in different domains. We analyze data from the second cycle, which took place in
2003. In this survey, students’ abilities were assessed in the three curricular domains:
mathematics, reading, and science plus the cross-curricular domain of problem-solving.
Students were also asked to provide individual information on their social and economic
background. We choose to analyze the PISA second cycle since its main focus was on the
domain of mathematics. In particular, 54% of the total student testing time was devoted
to the assessment of mathematical skills (1).
The PISA target population is made up of all students in any educational institution
between the ages of 15 years and 3 months and 16 years and 2 months at the time of the
assessment. This specific age has been chosen because it is close to the end of
compulsory education in most countries (1). Efforts have been made to insure the absence
of cultural or national biases in the test items [see for example (2)] and in the evaluation
of performance (3).
The student data set contains 276,165 observations, which roughly represent a population
of 19,155,864 15-year-old students attending seventh grade or above in 41 countries, 30
of which belong to the Organisation for Economic Co-operation and Development
(OECD). From this data set, we dropped Liechtenstein because the data contain only 165
observations, which make problematic any calculation of the tail of the distribution (all
the other countries have at least 639 observations); moreover, Liechtenstein has no
measure of gender equality.
————————
PISA din 2003 se gaseste aici:
http://www.pisa.oecd.org/document/5/0,3343,en_32252351_32236173_33917573_1_1_1_1,00.html
PISA din 2006, in schimb:
http://www.pisa.oecd.org/pages/0,3417,en_32252351_32236191_1_1_1_1_1,00.html
include si romania – si diferenta intre scoruri la fete si baieti la citire e -44 (in zona uruguay, austria, cehia, norvegia, estonia, montenegro) iar la matematica +7 (cel mai aproape de rusia, serbia si slovenia). la stiinta e -2 (la fel ca montenegro, croatia, korea).
oricum din articolul din science, astea sint clasamentele cu nr. de fete/nr. de baieti cu scoruri in primii 1% (in ordine crescatoare), la:
— CITIRE:
Macao
Turkey
Japan
Tunisia
Rep. of Korea
Russian Fed.
USA
New Zealand
Brazil
Mexico
Australia
Canada
Netherlands
Norway
Ireland
Hong Kong
Poland
Belgium
Uruguay
Denmark
Germany
Greece
Spain
Hungary
Portugal
Czech Rep.
Luxembourg
Serbia and Montenegro
Switzerland
Latvia
Italy
Indonesia
Austria
Slovak Rep.
United Kingdom
Thailand
Sweden
Finland
France
Iceland
— MATEMATICA:
Macao
Italy
Turkey
Greece
USA
Rep. of Korea
Belgium
Serbia and Montenegro
Slovak Rep.
Hong Kong
Portugal
Uruguay
Brazil
Japan
Germany
Finland
Switzerland
New Zealand
Norway
Hungary
Russian Fed.
Luxemburg
Tunisia
Australia
Poland
Latvia
France
Netherlands
Mexico
Ireland
Austria
Spain
Czech Rep.
Canada
Denmark
Sweden
Indonesia
United Kingdom
Iceland
Thailand
la “emanciparea femeilor” e mult mai complicat cu clasamentele, dar sursele sint astea:
———————————–
Measures of women’s emancipation
In our discussion, we use variables on the position of women in society from four
sources. The first is the “gender gap index,” which we will refer to as women’s
emancipation (GGI), prepared by the World Economic Forum (we take the year 2006
series) (7). This indicator synthesizes the position of women in any given country by
taking into accounts economic opportunities, economic participation, educational
attainment, political achievements, and health and well-being. Larger values point to a
better position of women in society.
The second series of data comes from our elaborations on the World Values Survey
(WVS), all waves (8). The WVS asks, among other things, a series of questions on the
role of women in society. The questions used are “When jobs are scarce, men should
have more right to a job than women” (V61), “A working mother can establish just as
warm and secure a relationship with her children as a mother who does not work” (V98),
“Being a housewife is just as fulfilling as working for pay” (V99), “Both the husband and
wife should contribute to household income” (V100), “On the whole, men make better
political leaders than women do” (V101), “If a woman earns more money than her
husband, it’s almost certain to cause problems” (V102) and “A university education is
more important for a boy than for a girl” (V103). For all but the first, levels of
agreements had to be expressed on a scale from 1 to 4. In the first question the answers
were “agree,” “neither,” and “disagree,” to which we attributed the respective scores of
1.5, 2.5, and 3.5. (“Don’t know” and missing answers are excluded.) We then inverted the
answers to questions V98 and V100, so that higher values indicate a better position of
women in society. The final index is the average by country of the answers to all these
questions.
The “Female Economic Activity Rate (% ages 15 and older)” is the share of the female
population of age 15 and older who supply, or are available to supply, labor for the
production of goods and services (10).
The “Political Empowerment Index” is computed by the World Economic Forum and it is
based on three components: (1) the ratio of females with seats in parliament over male
value (International Parliamentary Union); (2) the ratio of females at ministerial level
over male value (U.N. Human Development Report); (3) the ratio of number of years of a
female head of state (last 50 years) over male value (World Economic Forum
calculations) (7).
———————————–
7. R. Hausmann, L. D. Tyson, S. Zahidi, The Global Gender Gap Report (World
Economic Forum, Geneva, 2006).
8. R. Inglehart et al., World Values Surveys and European Values Surveys, 1981–1984,
1990–1993, and 1995–1997 [Computer file, Interuniversity Consortium for
Political and Social Research (ICPSR) version] (Institute for Social Research,
Ann Arbor, MI, 2000), distributed by ICPSR.
10. ILO (International Labor Organization), Estimates and Projections of the
Economically Active Population, 1980–2020 [Database, ed. 5, rev. 2] (ILO,
Geneva, 2005).
— de ex., pt. cele 4 variabile, tarile cu cel mai bun si cel mai prost scor, respectiv, sint:
* women’s emancipation (gender gap index): Iceland (0.78), Turkey (0.59)
* avg. wvs indicator: Sweden (3.17), Austria (2.41)
* female activity rate: Iceland (70.9), Turkey (27.8)
* women political empowerment: Sweden (0.55), Russian Fed. (0.03)
doar citeva parti care mi s-au parut interesante din cele publicate…
ps: an older post from me that includes some useful resources: “ms geek and other good stuff”


it should be said that pisa testing has received critiques from many directions, especially for cultural bias and its failure to adequately address factors such as socio-economic background of survey subjects and other essential parameters which further complicate interpretation of the results